Free Team Personality Test
See how the people on your team prefer to work. Take the 5-minute Big Five test, invite your teammates, and explore the profiles they choose to share on one team map.
Setting this up for others?
Am relaxed and handle stress well
Am outgoing and sociable
Am inventive and find clever ways to do things
Tend to find fault with others
Am dependable and steady
What it is
What is a team personality test?
The same questionnaire for everyone, and one map that shows how the answers sit together.
A team personality test is a personality questionnaire that each member of a team takes individually, with the results brought together so the group can see how its members differ and overlap. This one uses the Big Five, the trait model with the most published research behind it: each person gets a private report, and the profiles people choose to share appear on a live team map with the team’s spread on every trait.
It describes working preferences, such as how much structure someone builds or how much they think aloud, and it does not measure ability, performance or fit. Used well, it gives a team a dignified vocabulary for differences that were already in the room.
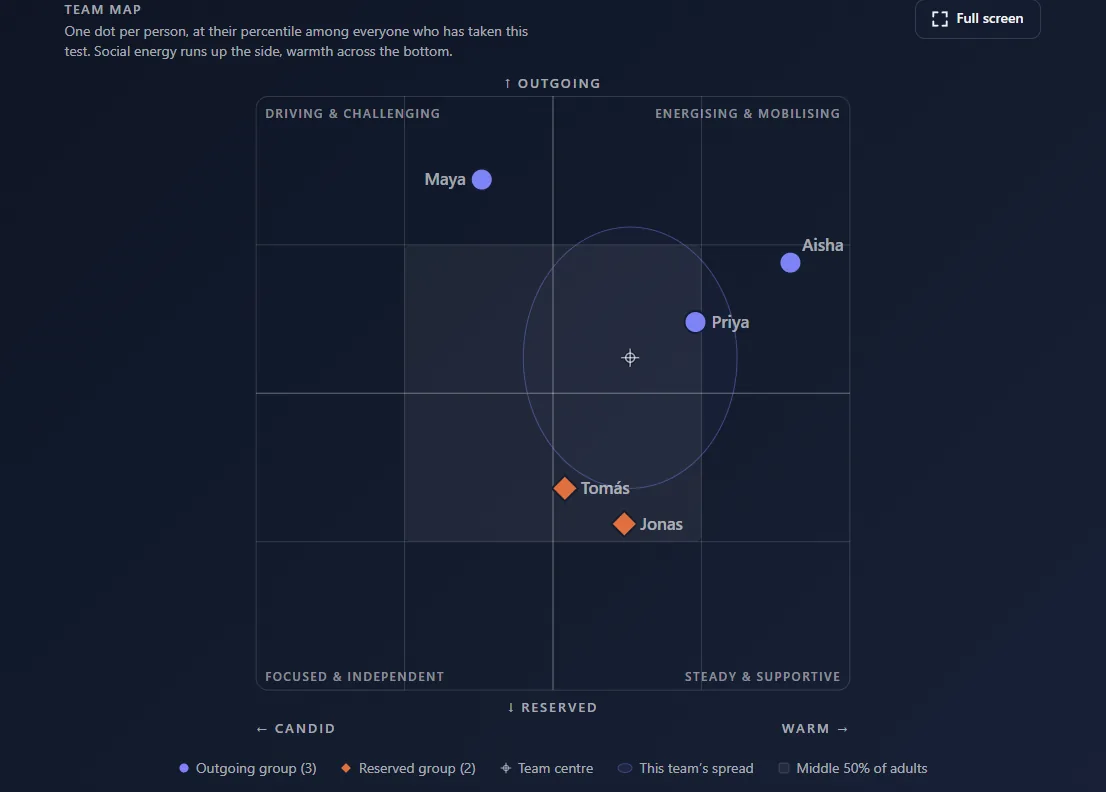
Fig 01 · The team report
What does the team report show? A five-person sample; yours uses only the profiles people share.
Sample report · fictional people
Synthetic profiles demonstrate the report. They never contribute to your team’s results.
Every person adds perspective.
Different minds. A shared picture.
Select a person, then another to compare. Brighter threads show closer trait profiles. The five points in each fingerprint follow curiosity, structure, energy, connection and composure.
Your voice · Maya Chen
You are the best judge of your experience.
Preview the participant’s controls using a fictional profile.
Start with the work
What would you like to improve together?
Add the context behind your goal, then choose one practice to try.
BETTER TOGETHER, BY DESIGN
Good groups start with a purpose.
Bring everyone into the right-sized groups for the activity. Explore what each group brings, then make the arrangement your own.
EXPERIMENTAL STARTING ARRANGEMENT
2 groups. 5 people included.
Complete a project · 2–3 people per group
Your groups
Suggestions for this activity. Bring in people’s skills, relationships and preferences before deciding.
How this arrangement was built
The experimental search uses authored goal targets and weights. It balances the member-weighted average model match (65%) with the lowest group match (35%). These choices are product assumptions; they do not establish group capability or forecast outcomes. Every possible arrangement at these sizes was compared within the kept-group constraints.
Inspect the suggested arrangement and compare it with the work you need to do. Kept groups remain intact on the next search. Changing group size releases them.
Compare arrangements at the same size and goal. Minimum and maximum trait measures can change with group size, so this model does not determine an ideal size.
| Group | People | Size |
|---|---|---|
| 1 | Priya Raman, Aisha Bello | 2 |
| 2 | Jonas Weber, Tomás Silva, Maya Chen | 3 |
Different objectives bring different working preferences into focus.
Every possible partnership
10 pairsGoal ordering follows experimental planning rules, not a validated compatibility ranking. Explore the actual responses and agree a way to work together.
Research & how suggestions are made
A goal-based planning guide
Trait numbers describe questionnaire responses. The search uses an internal match to authored goal profiles, with no validated conversion from that match to performance. Descriptive charts display mean trait percentiles, never an exact capability or compatibility rating.
Big Five research finds modest, context-dependent links with team outcomes. This prototype retains the report’s goal profiles; the numerical targets, weights and search priorities are design assumptions, not a formula validated by these studies.
Check the suggestion against real work
Conscientiousness and agreeableness can support coordination; other patterns depend on the task. Different personalities do not automatically create a better group. Skills, shared experience and how people interact matter too.
Choose the group size that suits the activity and available time. There is no universally best size.
Bell, 2007 ↗Peeters et al., 2006 ↗Han et al., 2024 ↗Bernerth et al., 2023 ↗
Goal fit is an experimental planning guide. Ask people about their skills, availability and preferences before agreeing a group.
01
Who is represented
Each person who chose to share appears with their five trait scores, and the report says how much of the team that covers.
02
How the mix fits the work
Goal Fit asks what the work needs and offers questions to check against your experience, not verdicts about people.
03
A practice to try
Suggested practices give the conversation somewhere to land: one change, an owner and a date to review it.
Fig 02 · How it works
How does this free team personality test work? One link, individual answers, and a shared map that grows as people choose to join it.
01 · About 5 minutes
Take the test
Answer 60 short statements. Before anything is shared you see your named trait profile and decide whether to add it. Your full report stays private.
02 · One minute
Invite your team
Your results carry an invitation link and email controls. Say why you are doing it and who will see the map. Each person chooses whether to share.
03 · 45 minutes
Read it together
The map updates as people finish and share. With one profile you see your own; the team picture starts with two. Then use the agenda below.

Who sees what. Your full individual report stays private. Anyone with the team link can see the profiles people choose to share, so the map is not anonymous, and anyone can withdraw their shared profile later.
Fig 03 · Put it to work
How to use team personality test results on real work
Start with something the team already wants to improve. The profiles add a perspective; they do not name the cause.
Make room for different contributions
Some people like to think aloud; others prefer a little preparation. A spread on Extraversion is a prompt to ask how people contribute best, not evidence of who dominates meetings. In studied groups, more even turn-taking went with better collective performance. [4]
Before the next decision meeting: would an agenda, or a few quiet minutes, help you contribute?
Clarify a handoff
Start with one real handoff that went wrong. Planning preferences may be part of the story; ownership, time and dependencies usually are too. A Conscientiousness score does not explain a missed deadline on its own.
What does done look like for this handoff, and who decides it is done?
Look at a decision from more than one side
Where Openness or Agreeableness responses differ, people may weigh new options and open disagreement differently. Disagreement about the task is not reliably harmful; its effect depends on how the team handles it. [5]
Who has not yet said what worries them about this option?

0:00 to 0:05
Set the frame
Name the purpose and the limits before anyone looks at a chart.
This map describes how we like to work, not how good we are. Nothing here touches reviews, and each of us is the final authority on our own result.
0:05 to 0:15
Own reports first
Each person shares one thing their report got right and one thing it overstates. Starting with disagreement shows that people outrank charts. A minute each.
What is one line yours got right, and one it got a bit wrong?
0:15 to 0:25
The map, together
Open the team report and check who is represented. Let people say where an interpretation fits and where it depends on the situation. Similar or different scores do not establish a strength, a gap or a conflict.
Which part fits your experience, and what would you change?
0:25 to 0:35
One real example
Choose at most two questions about recent work. Check that people agree there is a problem, then look at responsibilities, capacity and dependencies alongside the responses.
What happened recently, and what else might explain it?
0:35 to 0:43
Agree one practice
Pick one or two changes from the report’s suggested practices, or your own. Each gets an owner, a measure and a review date. Two kept practices beat five aspirations.
Which single change would make this easier next month?
0:43 to 0:45
Close out loud
One sentence each: something learned about a colleague, or something they will do differently.
Example practice
Send the agenda a day before every decision meeting.
Owner
Whoever chairs that week’s meeting.
Measure
Everyone has spoken before a decision is taken.
Review
In four weeks, at the team retrospective.
Fig 05 · Choosing an instrument
Which personality test is right for your team? Six common approaches, what each measures, and what a team can honestly read from it.
| Test | What it measures | Evidence for teams | What a team map can show | Best for |
|---|---|---|---|---|
| Big Five (this test) | Five continuous traits: Openness, Conscientiousness, Extraversion, Agreeableness, Emotional stability. | Strongest. Meta-analyses link team trait composition to performance across hundreds of teams. | Where each person sits on every trait, the team’s spread, and who is at the ends. | An honest, comparable picture and a debrief where people can disagree with their own report. |
| DISC | Four behavioural styles (D, I, S, C) from pace and task-versus-people focus. Everything DiSC is the best-known commercial version. | Limited. Widely used, but little peer-reviewed evidence that a style predicts anything about a team. | A quick shared vocabulary for communication and pace. | A fast, low-stakes conversation about how people like to be approached. |
| 16 types | Four preference pairs combined into one of sixteen type labels, the format 16Personalities made popular. | Weak for teams. The type label changes on retest for a large share of people, so a team chart built on labels is unstable. | Memorable labels people already know. | Icebreakers and individual reflection, not planning. |
| Colour tests | Four colours standing in for energy and behaviour (red, blue, green, yellow in most versions). Insights Discovery is the best known. | Little independent research. Most are proprietary workshop products. | A simple, visual shorthand. | Short workshops where memorability matters more than precision. |
| Belbin team roles | Nine team roles from self-ratings and, ideally, observer ratings. | Moderate as description, weaker as prediction. The roles overlap with the Big Five. | Which kind of contribution each person gravitates to. | Allocating responsibilities on a project team. |
| Strengths tests | Dozens of named strengths or character themes, ranked per person: CliftonStrengths, HIGH5 and the VIA Survey. | Reliable for self-description; not designed to describe a team’s composition. | What each person likes doing and does easily. | One-to-one development conversations. |
How to choose. Decide what the result has to do. A style or type test is enough for one conversation; a trait model is what you want when the picture has to be comparable across people and worth revisiting. Then ask three questions of any instrument: is each person’s result on the same scale as everyone else’s, can the interpretation be checked against real work, and can someone disagree with their own report without having to defend a label? For the free tests a whole team can run together, and how Hogan, Predictive Index and the Enneagram fit in, see personality tests for team building, compared.
Why this page uses the Big Five. It is the model the team-composition research was done with,[2][3] it scores people on continuous scales rather than boxes, and every ending of every trait can be described with dignity. The evidence for the model is not evidence for this adapted questionnaire or for any team prediction; the limits section below says exactly what is and is not measured.
Fig 06 · What it measures
What does a team personality test measure?
Five traits, and a question for each. A team personality test brings individual self-reports together so people can talk about how they like to work. Neither end of a trait is the good end.
How drawn someone is to new ideas and unfamiliar approaches.
AskWhere do we need new options, and where do we need the proven one?
How much structure someone builds and how they like to plan.
AskWhich handoffs need a checklist, and which need room to adapt?
How much someone thinks aloud and puts into a room.
AskDo our meetings give quieter thinkers a way in?
Whether someone defaults to keeping the peace or saying the difficult thing.
AskHow do we raise a concern here, and does it get heard?
How strongly pressure registers and how quickly it passes.
AskWhat does this team need when workload spikes?
Fig 07 · Evidence and limits
What a team personality test can and cannot tell you Three different things, with three different levels of evidence.
Measured
Your answers
A 60-item Big Five questionnaire adapted from BFI-2 wording. Published validation concerns the original inventory, not automatically this adaptation.[1]
Described
The team summary
A description of the profiles people chose to share. Research links team personality composition with performance across many teams, but those averages do not forecast a named team.[2][3]
Suggested
Practices to try
Authored prompts and hypotheses. We have not published predictive validation for them, so judge each one by what happens in the work.
Where we stand, and what this is not for
Designed for
Voluntary team reflection: a shared, dignified language for differences that were already in the room, and a debrief where people can disagree with their own report.
Not designed for
Hiring, promotion or termination decisions; judging ability or motives; singling out a colleague; or diagnosing anything. Agree how results will be used, and who can see them, before inviting people.
How scores are referenced
The questionnaire is scored in the browser. Percentiles use distinct completed score profiles from people who took this English test. That reference is not representative of adults or workforces, and its deduplicated profiles are not verified unique people.
Who built it
SeeMyPersonality builds and runs this assessment and team map. The methodology documents the inventory, scoring, reference data and interpretation rules.
Fig 08 · Common questions
Team personality test questions, answered
Which test to choose, sharing, participation, facilitation and what the report can and cannot do.
What is a team personality test?
A team personality test is a personality questionnaire that each member of a team takes individually, with the results brought together so the group can see how its members differ and overlap. This one uses the Big Five model: every person gets a private report, and the profiles people choose to share appear on one team map with the team’s spread on each trait. It describes working preferences, not ability or performance.
Which personality test is right for my team?
Choose by what you need to do with the result. If the team wants a shared vocabulary for a single conversation, a style or type test is quick and memorable. If you want a picture you can compare across people and revisit, use a trait model with published research behind it: the Big Five is the best-evidenced option. Check three things before committing: whether each person’s result is comparable with everyone else’s, whether the interpretation can be checked against real work, and whether people can disagree with their own report. The comparison above covers the common options.
Should teams rely on personality tests?
No test should decide anything about a team on its own. Research links team personality composition to performance on average, but an average does not forecast a named team, and a self-report describes how someone sees themselves, not how they will act on Thursday. Use the results as one input to a conversation about real work, alongside skills, roles, workload and what people say directly. Never use them for hiring, promotion or blame.
How do I set up a team personality assessment?
Take the assessment above, or choose “Create an invitation link” to set up a team without taking it. Save your organiser link, set the intended team size and invite people with the link or email controls. Participants preview their named trait profile and approve sharing before joining the map. Each keeps their full personal report private. The shared report uses only completed, shared profiles and shows how much of the intended team is represented.
How many people do we need for a team map?
One person can start it, and the shared team picture starts with two profiles. Small groups are normal: in our September 2026 snapshot of 60 Big Five maps with at least two shared profiles, the median map held four, and about two-thirds held two to five. That counts profiles shared on those maps, not the full size of the teams, and known test and demo maps were excluded.
Is the Big Five better than type-based tests or DISC for a team personality assessment?
We use five continuous Big Five dimensions because they provide a researched foundation for describing personality differences. Named styles and four-letter types can also help people start a conversation, but any label needs checking with the person. The strength of published Big Five research does not automatically validate this adapted questionnaire, a role assignment or a team-performance prediction.
Is a team personality assessment anonymous?
This shared map uses names and trait scores, so it is not anonymous. Anyone holding the team link can view shared profiles, including the organiser. Full individual reports stay private, and reflections are private unless the participant chooses to share them. Explain this before inviting people. They can decline, preview sharing, make reflections private again or withdraw their shared profile.
What if someone on the team does not want to take it?
Respect that choice without asking them to justify it. The report shows only the completed profiles people agreed to share and states the participation count. Do not infer an absent person’s traits, motives or reason for declining. Continue the conversation using real work examples and preferences people choose to describe directly.
Can a team personality assessment detect mental health problems?
No. This questionnaire describes self-reported personality tendencies; it is not designed to diagnose or screen for mental health conditions. Emotional stability scores should not be used to infer a diagnosis, burnout or a need for treatment. Discuss workplace pressures and support without diagnosing colleagues from their profiles.
Can people fake their answers on a team personality assessment?
Self-reports can reflect how someone wants to be seen, their interpretation of an item or the situation they have in mind. Team participation does not remove those influences, and colleagues are not a lie detector. Explain the purpose, audience and choice to opt out. Invite people to qualify interpretations and offer examples without having to defend their score.
Do we need an external facilitator to run a team personality assessment?
A trusted team member can use the timed agenda if people are comfortable participating. Consider a neutral facilitator when conflict or authority makes open discussion difficult. Agree the purpose, participation choices and boundaries first; the questionnaire cannot establish whether the group feels safe enough to discuss its results.
Are fun or quick personality tests good enough for team building?
They can provide an icebreaker when everyone understands the limits. Length alone does not establish quality. Look for clear scoring, relevant validation evidence and a chance to disagree with the interpretation. Avoid turning any quiz label into a claim about someone’s ability or the cause of a team problem.
Are colour personality tests good for teams?
Colour tests sort people into four colours, usually red, blue, green and yellow, as a shorthand for energy and behaviour. They are easy to remember and fine for a short workshop, which is why they are popular. Their limits are the same as any four-box model: most people sit near the middle of at least one dimension, the colours have little independent research behind them, and a label invites the team to explain everything by it. If you want a picture that stands up to a second look, a five-trait model shows where each person actually sits instead of which box they fell into.
Is there a free printable personality test for team building?
This assessment runs online and scores responses in the browser. The debrief agenda, individual reports and team report can be printed for discussion. The questionnaire itself is not offered here as a paper scoring form. Check who will receive printed profiles before distributing them.
What is a team dimensions profile, and how is this different?
Team dimensions and role-profile tools describe collaboration using named roles or working preferences. This report starts with five continuous personality dimensions and asks people to interpret them in context. Suggested contributions are optional discussion prompts, not measured job suitability. Responsibilities should be agreed using skills, availability, experience and stated preferences.
Keep reading
Team charter builderTurn the practices you agree in the debrief into one page the team keeps. Personality tests for team buildingThe free tests a team can run together, and the paid instruments, in one comparison. Managing different personalitiesScripts for the one-on-ones that follow a team conversation. Team compatibility testThe pair-level read: how two specific people are likely to work together, and what to agree on. DISC assessment for team buildingThe four-style vocabulary on a live team map. How the four DISC types differD, I, S and C in plain words, the twelve blends, and how common each one is. How each person prefers to communicateA four-minute quiz that gives a team four plain words for it: Direct, Animated, Considerate, Precise. Measurement and interpretation methodologyThe inventory, scoring, reference data and authored interpretation rules.About this page
Written and reviewed by Michael Hodge, founder of SeeMyPersonality. BSc Psychology (University of Wollongong), with coursework in psychometrics and research methods. He designs and reviews the questionnaires on this site and wrote the team map’s aggregation rules. More about the author
Sources (5)
- [1] Soto, C. J. & John, O. P. (2017). The next Big Five Inventory (BFI-2). Journal of Personality and Social Psychology.
- [2] Bell, S. T. (2007). Deep-level composition variables as predictors of team performance: a meta-analysis. Journal of Applied Psychology.
- [3] Peeters, M. A. G., van Tuijl, H. F. J. M., Rutte, C. G. & Reymen, I. M. M. J. (2006). Personality and team performance: a meta-analysis. European Journal of Personality.
- [4] Woolley, A. W., Chabris, C. F., Pentland, A., Hashmi, N. & Malone, T. W. (2010). Evidence for a collective intelligence factor in the performance of human groups. Science.
- [5] de Wit, F. R. C., Greer, L. L. & Jehn, K. A. (2012). The paradox of intragroup conflict: a meta-analysis. Journal of Applied Psychology.